Road safety statistics for Bromley
Bromley has a good road safety record and reducing casualties remains central to Bromley’s transport priorities. These are set out in our Local Implementation Plan, with a focus on reducing casualties killed or seriously injured (KSI) on the borough’s roads. This is achieved through a programme of treating priority collision hot spots and delivering a targeted road safety education programme. Looking at comparative data for the 2020 to 2024 five-year average for London boroughs, compared to baseline data, Bromley saw the largest decrease in KSIs - a 51 per cent decrease.
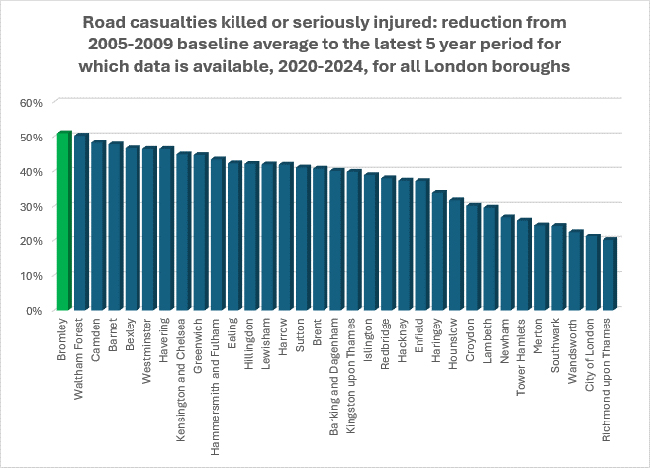
The 2005 to 2009 period is used as a road casualty baseline in London to align with the Department for Transport’s (DfT) Strategic Framework for Road Safety (2011). This five-year average provides a stable, consistent benchmark for measuring long-term progress in reducing KSI casualties.
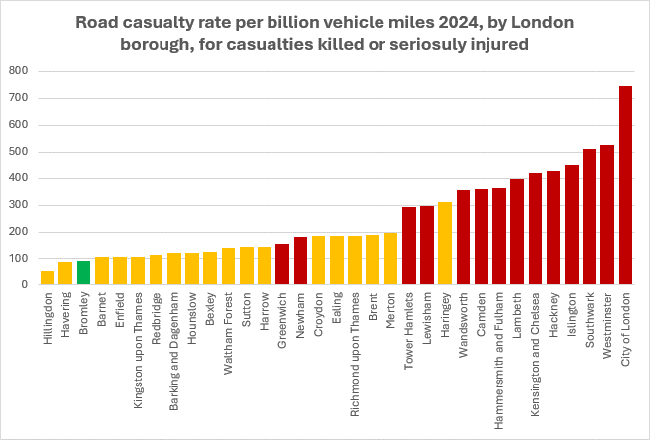
As London’s largest borough, with most miles of road, it is helpful to look at casualty rates in the context of road length and number of journeys. Casualty data for 2025 has not been published at the time of this study, but 2024 data shows that Bromley has one of the lower casualty rates in London, with 94 KSI per billion vehicle miles, which is the third lowest in London.
However, the council is not complacent and is continuing to invest in actions to further reduce road casualties as part of a continued long term downward trend.